Home
Login
RSS Feed
ATOM Feed
Tag cloud
Les liens de StyMaar
toggle menu
Add link
Search
15567 links
51 results tagged
dataviz
x
Simon Kuestenmacher (@simongerman600): "Another US election, another "Land doesn't vote, people do" style map showing the election results." | La Contre-Voie - nitter
Draw SVG rope using JavaScript · Muffin Man
Picture This: The Periodic Table | Broadcast
Sunken Ships of the Second World War
Sound – Bartosz Ciechanowski
Simulating an Entire Car Engine (yes, it makes noise) - YouTube
The Illustrated TLS 1.3 Connection: Every Byte Explained
Random Distribution of Wealth (2)
A Visual Guide to the Aztec Pantheon
The Animated Elliptic Curve
Vivien GUEANT (@lafibreinfo): "Google #Chrome a maintenant plus de 80% de part de marché, et c'est une bonne nouvelle pour personne. Source de la vidéo : https://www.reddit.com/r/dataisbeautiful/comments/v3c9nv/oc_web_browsers_over_the_last_28_years/"|nitter
Combien de députés peut espérer la Nouvelle union populaire : la carte des circonscriptions gagnables - Basta!
https://pbs.twimg.com/media/En7Q4vhWEAAWJay?format=jpg&name=4096x4096 (Image JPEG, 2897 × 4096 pixels) - Redimensionnée (22%)
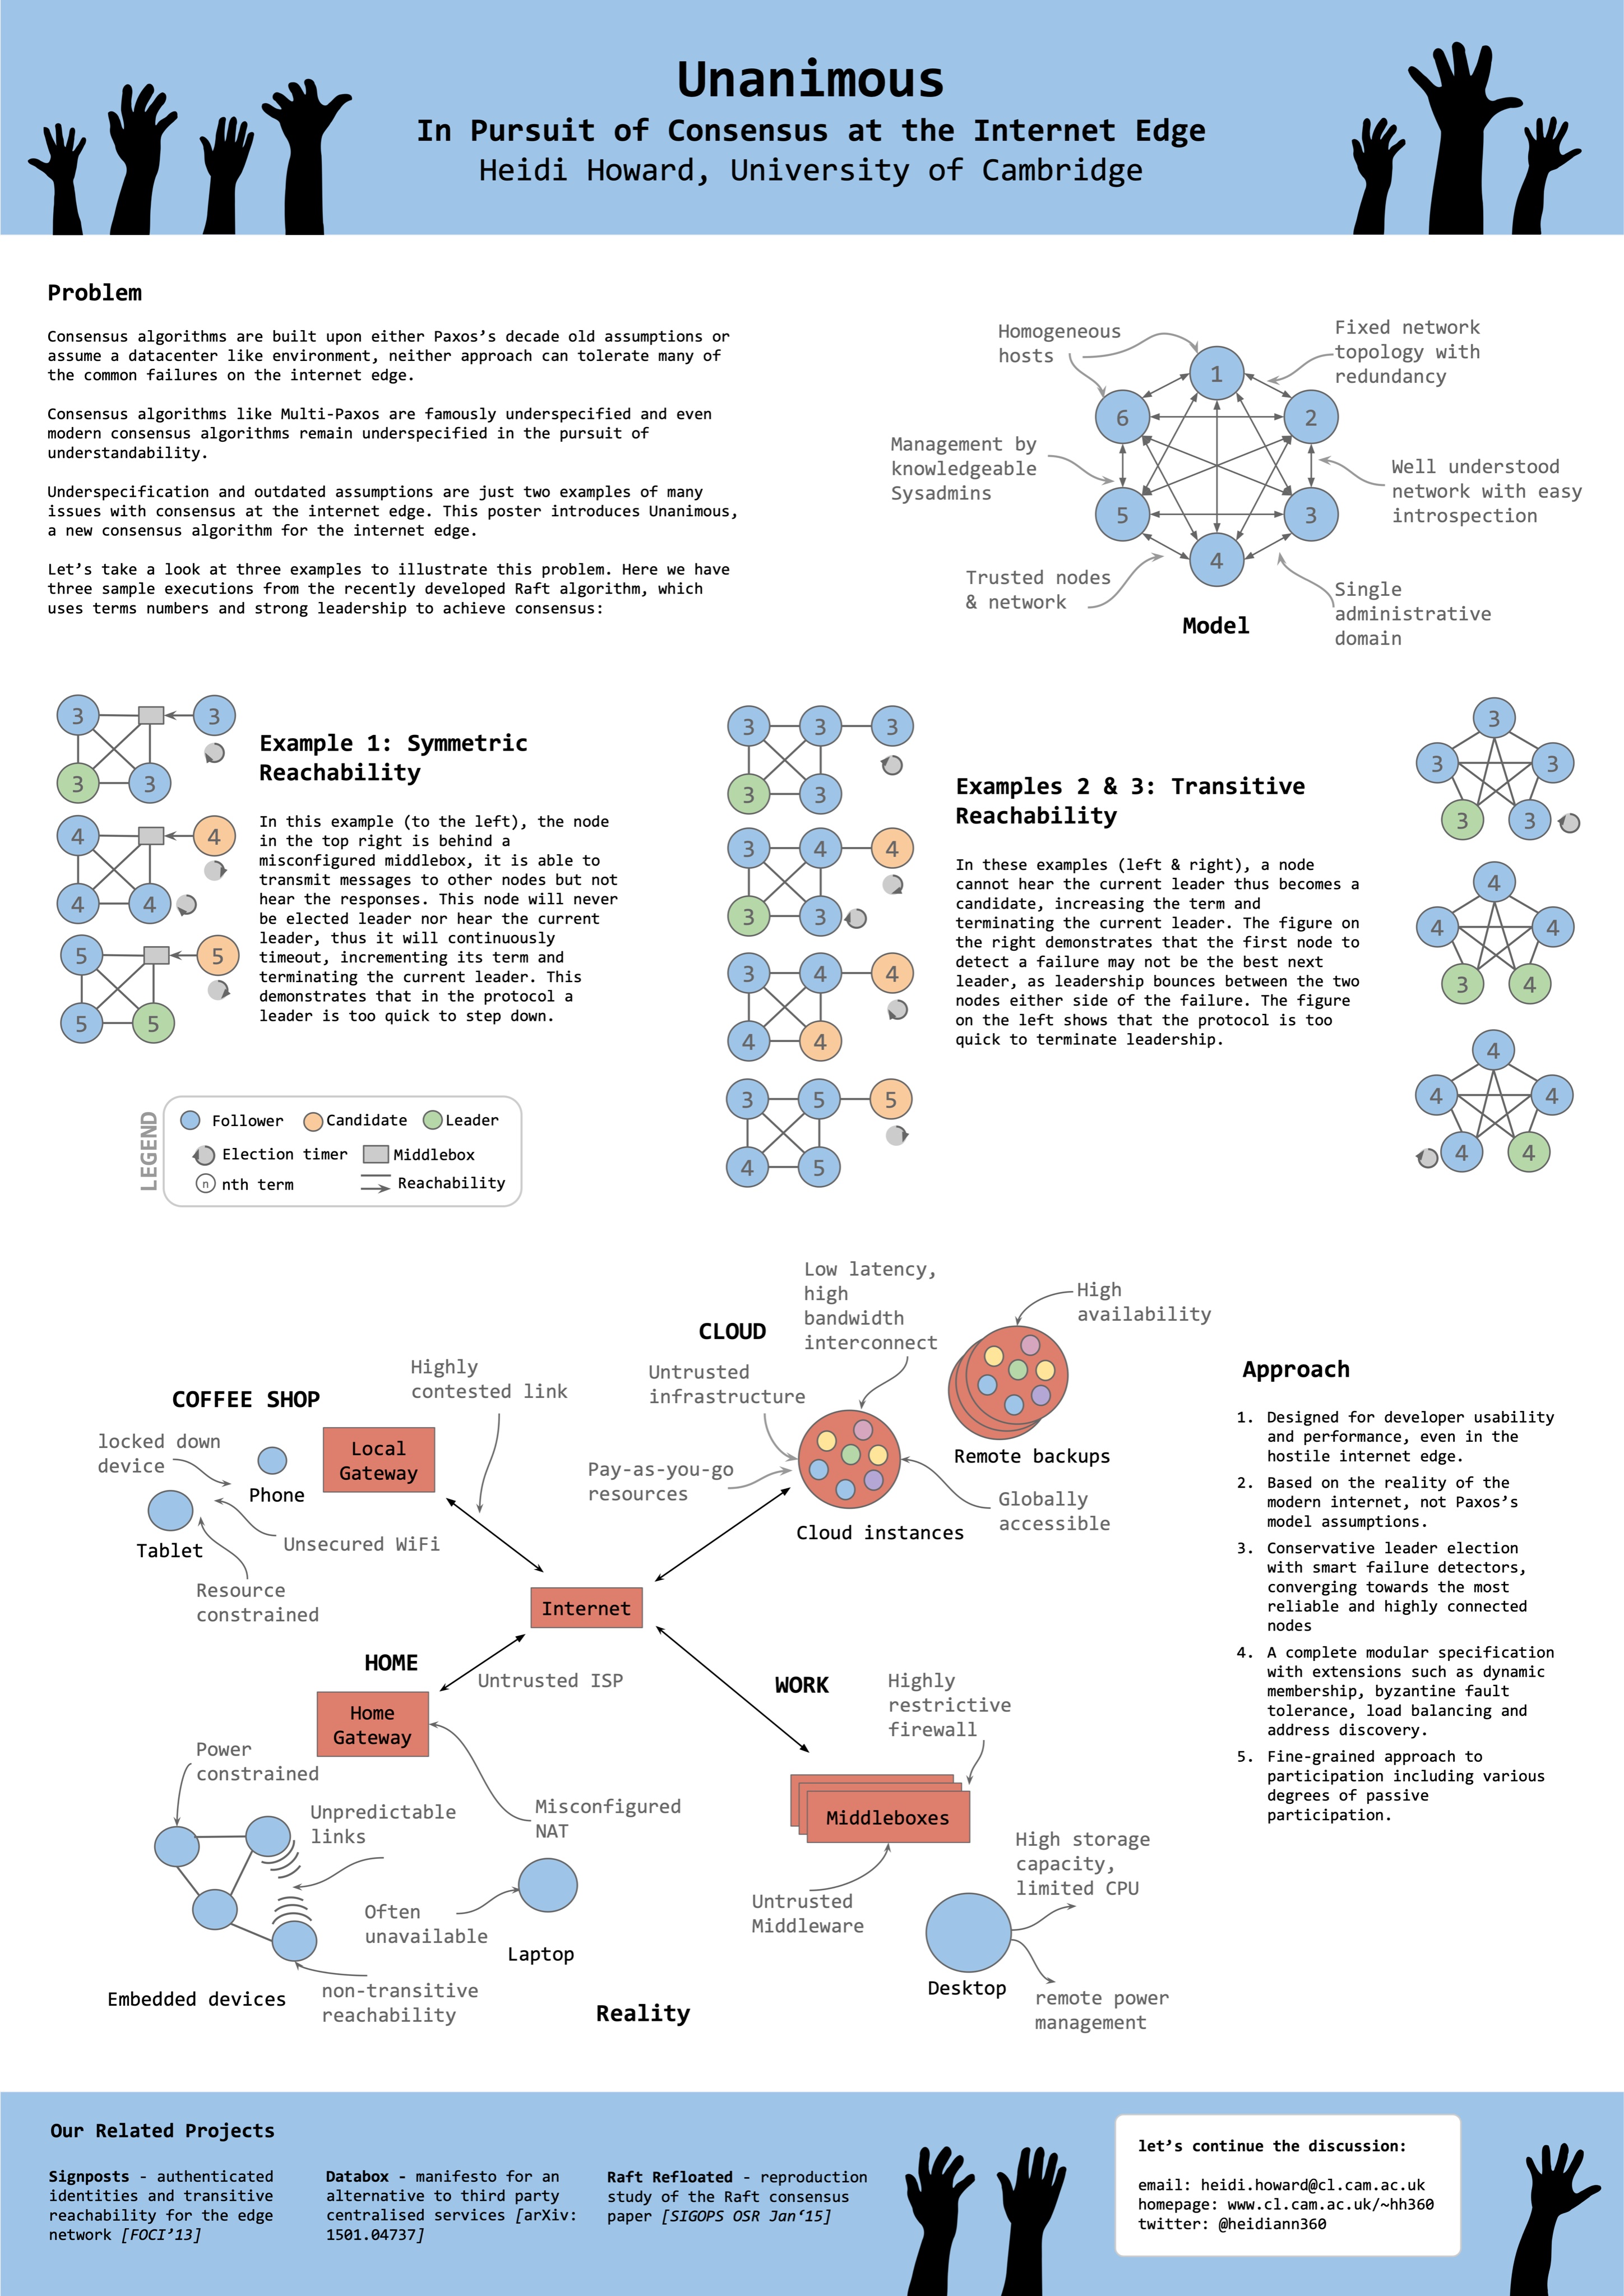
MultiPaxos
coulmont on Twitter: "Nombre quotidien de décès, 2001-2021 (jusqu'au 17 mai), en version polaire animée. Canicule, grippes et covid en moins de 2 minutes. Faites vous vacciner pour ne pas devenir une statistique ;-) https://t.co/Twn9rSv1ts" / Twitter
Animated Engines - Home
Randall Munroe sur Twitter : "2020 Election Map https://t.co/UhqewBjOBT https://t.co/XK0ek4BdOd" / Twitter
Gears – Bartosz Ciechanowski
Covid : les 2 vagues de réanimation
Explain Git with D3
◄Older
page 2 / 3
Newer►
Links per page:
20
50
100

 Simon Kuestenmacher (@simongerman600): "Another US election, another "Land doesn't vote, people do" style map showing the election results." | La Contre-Voie - nitter